SME-FX › Forums › Commercial › Trade reviews
- This topic has 67 replies, 6 voices, and was last updated 3 years, 7 months ago by
 Thuy Pham.
- AuthorPosts
- November 30, 2022 at 8:47 pm#46351
 Tim TimParticipant
I’m starting this thread so members can post in their trades and other members can give their opinions and discussions can be created around the trades. feel free to post any trades below
- November 30, 2022 at 9:02 pm#46354Tim TimParticipant
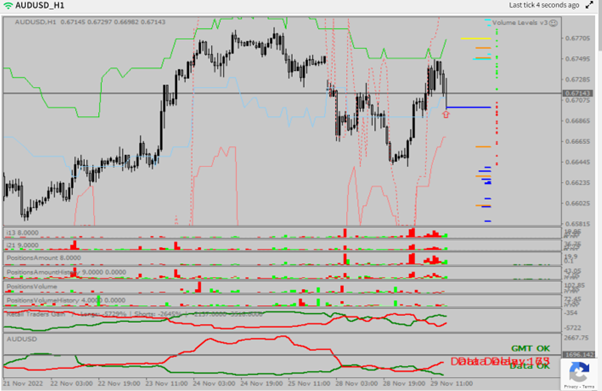
29.11.2022 Long AUDUSD
Trade idea: Move up to stop out the rest of the shorts
Y-axis PB: some old longs in the way but new short fuelling the move up
X-axis PB: DM placed on short side
Net DM: possible shorty squeeze coming
Net T-in-prof: No position in profitACC: Demo
Entry 0.67145
SL 0.66475 (below lower MT stop)
TP 0.67710 (at upper MT stop)
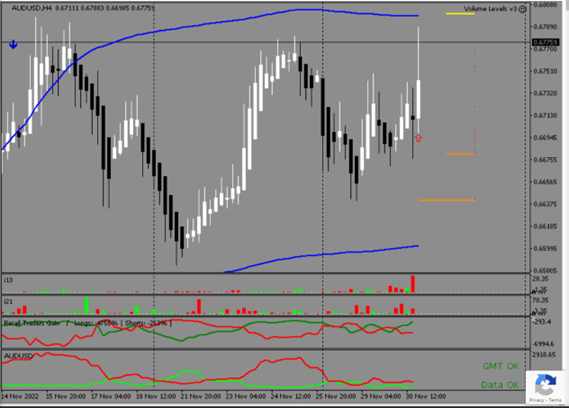
Take profit moved higher on strong news reaction (US FED chair talk) and new shorts entering, to 0.67910 to upper stop on 4H

Trade closed at upper stops 0.6917

- December 1, 2022 at 2:34 am#46385Christopher MirandaParticipant
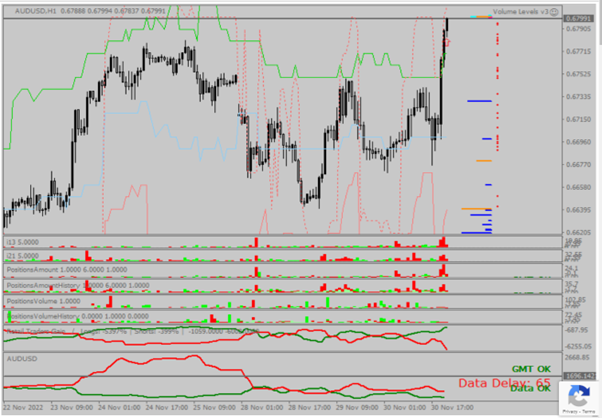
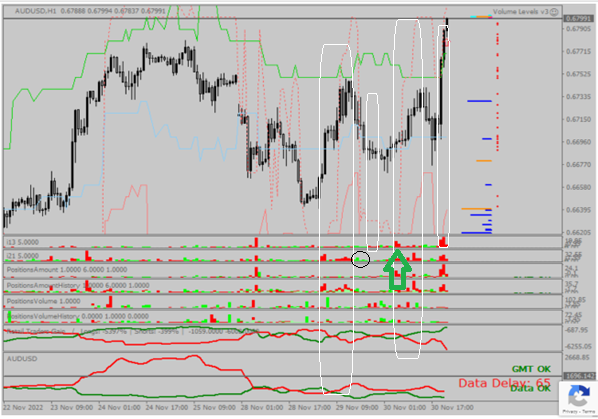
So many great moves here, it’s beautiful to see. You held some drawdown but it was a decent move, nice. You entered when longies began to enter also, so aim to enter when shorties enter, just a heads up 🙂 (I circled the longies on your pic, they are in the 2nd histogram on the x-axis, only really visible on the historical histogram because they have been taken out/ left the market in the later picture.)
Each box I made, and the spaces in between, all show the market moving to the significant DM at the time. Do you see that also? The 2nd small one is to show that even small wicks/counter moves can be seen and understood in the MK. - December 1, 2022 at 2:03 pm#46487Tim TimParticipant
Great Chris, thanks for feedback.
so your entry trigger would have been a spike in longs. I will add a screenshot below with a green arrow, would this be a better entry location?

- December 1, 2022 at 2:59 pm#46498AnonymousInactive
My jaw is hanging off my face with this MK-Indicator shit……un-fkn-believable. It really is.
3 screenshots. Trade Entry. Trade Close, and what the MK stream looked like.
Now, to be sure, this would be a standard setup of mine anyhow, in a hard trending market, but also one I would balk at taking, for very good reasons. HOWEVER it was seeing all those big short positions coming alive on the MK Stream, during a period of ‘dumb money tolerance’ for the longs, that crystalised what would otherwise seem a very uncertain trade, into a trade that I definitely should be taking.
- December 1, 2022 at 4:59 pm#46513Tim TimParticipant
Ye I’ve had minimal success using technical analysis and order flow for a couple years. This seems to be the missing piece
- December 1, 2022 at 5:20 pm#46519Christopher MirandaParticipant
Aha we know the feeling, simply amazing. Definitely a good trade against the shorties, though I wouldn’t consider there to be too much DM tolerance as the NetDM is very low and there are almost no green PB’s above price (arrow 2 in my pic).
Something very cool is also happening during your trade. See that MTS right below price in your image? Notice how price went down before going upwards against the shorties (arrow 1)? That’s the SM algo taking out close by inner range stops before moving in the overall direction. That is what retracements can often be, hiding in disguise, some mind blowing shit eh?- December 1, 2022 at 7:31 pm#46549AnonymousInactive
The big orange tranche of long SLs was left untouched for the rest of that move, and still hasn’t been touched……
…….I am often guilty of when getting into a trade that runs say 1.75:1 RR, and then comes right back and puts me underwater, I will very often exit at scratch. ‘They’ don’t always have to run the SLs to shake out the fleas. I would have been very tempted to leave that trade scratch had it been higher timeframe and had I had enough to time to let the anxiety grind…AND had it been for more meaningful amount of money…(keeping it small whilst I incorporate the MK-Indicator into my trading).
But yeah…I did have my eye on that level for that reason, AND it would have been cool had it been pinged before shooting way back up higher….but it wasn’t, and still hasn’t been. Although the longies were in good profit, there were very few of them, so I guess there was no need to clean them out (possibly letting lots of shorts escape with their shirts on their backs)
- December 1, 2022 at 8:49 pm#46558Christopher MirandaParticipant
I was pretty sure it didn’t retrace enough to hit the SL but meh close enough lol, same principle.
- December 1, 2022 at 4:02 pm#46509Christopher MirandaParticipant
Great Chris, thanks for feedback.
so your entry trigger would have been a spike in longs. I will add a screenshot below with a green arrow, would this be a better entry location?
A spike in SHORTIES good sir, not longies. Red bars = shorties, green bars = longies. Though yes your arrow is in the correct place 🙂
- December 1, 2022 at 5:00 pm#46514Tim TimParticipant
ye shorts I mean 🙂
- December 1, 2022 at 5:12 pm#46515Tim TimParticipant
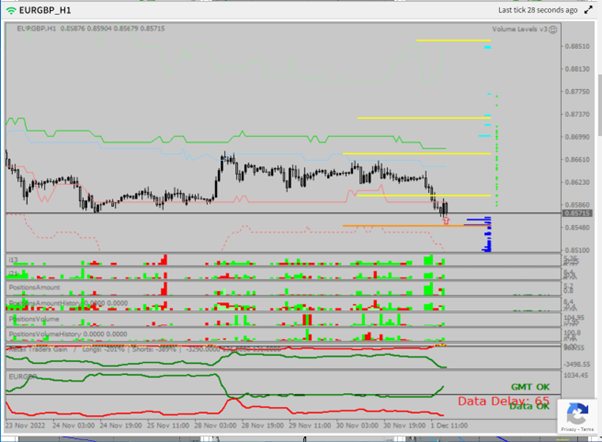
Trade: scalp Short EURGBP
Trade idea: move down to take out lower MT stop
Y-axis PB: No shorts in the way and longs above to block price
X-axis PB: Large new longs just entered market
Net DM: long sqeeze
Net T-in-prof: shorts in profict
Lev Positions: New over leveraged longs just entered
1D chart: Close to the lower MAEntry: 0.85688
SL:0.85960 (below lower MT stop and long positions)
TP:0.8550(at the low MT stop and MA)
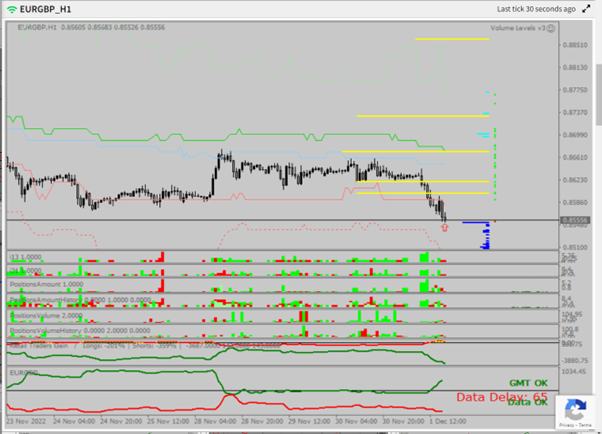
I closed the trade after lower MT stop was removed

What’s people opinion on closing positions when stop targets are removed?
- December 1, 2022 at 6:31 pm#46538Christopher MirandaParticipant
Great trade. Personally, when it comes to scalps/short term direction, I close immediately if a stop target that I’m aiming for is removed and the DM PB’s on first histogram decrease, which coincidentally is exactly what happened on your pics.
- December 1, 2022 at 7:37 pm#46550AnonymousInactive
By my reckoning, the SL was hit…or the level that the SL was at, was certainly hit.
- December 1, 2022 at 8:44 pm#46557Christopher MirandaParticipant
yea it looks like it was extremely close or dead on, I havent checked live charts yet.
- December 1, 2022 at 9:17 pm#46564AnonymousInactive
And then up to get the short Mid Term SL tranche…..and by my reckoning, given the downward momentum from conventional chart analysis……the ‘Mr Obvious’ Wyckoff check short level up where the 2nd Short SL tranche is sitting…..COMBINED with the over DM Long heavy situation, EURGBP most likely tags this close range short SL level, then turns back down on a sixpence?
That is my bet anyhow…..for small stakes of course, whilst I get a grip of this stuff….
- December 1, 2022 at 9:25 pm#46572AnonymousInactive
^I have no idea why 5 jpeg uploads happened, when I intended just two.
- December 1, 2022 at 9:41 pm#46573AnonymousInactive
The ‘Mr Obvious’ textbook short, that may or may not get filled…BUT NOT before the over heavy longies have been put through a world of pain first.
My read on the MK Indicator, is that once the Mid Term shorties have been RINSED, going much further up that chart just gives longs the chance to jump out their underwater trades with their shirts still on their backs….
……I shall watch with interest, and learn.
- December 1, 2022 at 10:55 pm#46586Christopher MirandaParticipant
I don’t know or understand any of the wyckoff stuff or any of the indicators on your chart but its all good. I can’t say I know where the market is headed, it depends on incoming DM flow, though these large moves tend to get full reversals, especially if there is a DM switch or a longer term direction change on the 4H. I won’t be touching anything at all until London open and the flood gates open again lol.
- December 1, 2022 at 11:08 pm#46587AnonymousInactive
Wyckoff check is just a retest of a very prominent Horizontal S/R level. The most text book trend following trade entry level out there….but interesting for this one, there is another short SL tranche sitting right on it…..(who the hell would place their stop right on a such a level likely to be retested as standard?)
Probably wise not to do anything new until after London open…..would never normally open an intraday trade going into US close, but got a new toy to play with…..interesting the way that it tagged the logical level leaving the Short SL tranche (according to MK-Indicator) intact and then backed right off. Does it come up again to get it, or has it already ‘got it’, with enough real market FX dealing desks? If the orderflow data is genuine retail broker orderflow data….then one retail broker will differ from the rest…..if on the otherhand it is some sort of stat based approximation on where heavy SL tranches most likely are….then an approximation is an approximation?
- December 1, 2022 at 11:25 pm#46590Christopher MirandaParticipant
okay thanks. The reality we’ve learned is that it is actually the majority who place their stops in those places, only to lose and be hunted over and over. You will hear Djamal talk about it in detail in a few videos here and there. Other than that, this thread has some info https://sme-fx.com/forums/topic/market-moving-against-entries/
I don’t know if it will come back up to get the stop you mentioned, but no, it has not been taken yet.
- December 1, 2022 at 11:42 pm#46592AnonymousInactive
I was taught to ‘tarde’ by a complete cluster-dunce, but even he had us place stops BEHIND Market structure that had broken down/up. NOT in front of, which is exactly where SL #2 is sitting. In FRONT of market structure, is where every trader and his dog places their entry….sometimes it even works.
- December 2, 2022 at 7:35 am#46645Tim TimParticipant
Thanks Chris, thats what I thinking(even if my trade did hit original target) Good to know to close positions when stops are removed.
Matthew I love you bringing technical analysis into your trades here and I know everything about TA from my past 2 years trading TA and orderflow. Iv come to the conclusion that too many trader know about “wyckoff,Fibs,orderflow………..(to many TA tools to talk about). So in my opinion they don’t work because crowded trade.
Why I ended up here!!! 🙂 I’m still demo trading here so don’t take my word for anything, just my opinion
- December 2, 2022 at 11:14 am#46662AnonymousInactive
It is very possible to trade consistently profitably without MK-Indicators.
I know this for sure. I have been doing it.
BUT.
From my early impressions, MK-Indicators, as janky and imperfect as they may be, are to a retail trader, what a wall-hack is to an FPS gamer. MK-Indicators It feels like ‘cheating’, which of course is something I have no moral issues with whatsoever!
My analogy would be, a good FPS gamer, playing with a wall-hack is going to be an even better FPS gamer, although a bad FPS player may not necessarily be a lot better playing with a wall hack. Ya still got to know ur technicals, and have a good feel for how the market moves, imo.
And on that note……I had a short working last night…..(shown in above jpegs)…
But then I noticed this shit appear on MK-Indicators……Shorties Come in Strong, appearance of chunky Near Term SL appearing in between two Mid Term Shortie Tranches, so I exited my short, and reframed my trade as shown, to align with a tag of the near term SL covering the recently acquired DM shorts, and what do ya know!?
Still not out the woods yet of course…..Longies still on the cards to experience most pain, but perhaps a bit of a ‘time n range’ game needing to be played with shorties who are getting more active, and with longies current Mid Term SL level is just a touch below price…..no where near my downside target.
- December 2, 2022 at 5:31 pm#46711AnonymousInactive
What is the deal with Blue SL levels. According to Djamal’s instructions, these are generally considered ‘incidental’ whilst the market focuses on the ‘Mid Term’ SL levels. What is the reasoning for this?
So far, I am finding the Blue SL levels very significant. If anyone can be bothered to scan my previous thread showing a EURGBP Short Reframe trade (still working sitting around 1.3 rr currently). The entry for that was literally slap bang on a big flat light Blue Short SL level that appeared on the back of a bunch of high DM short volume.
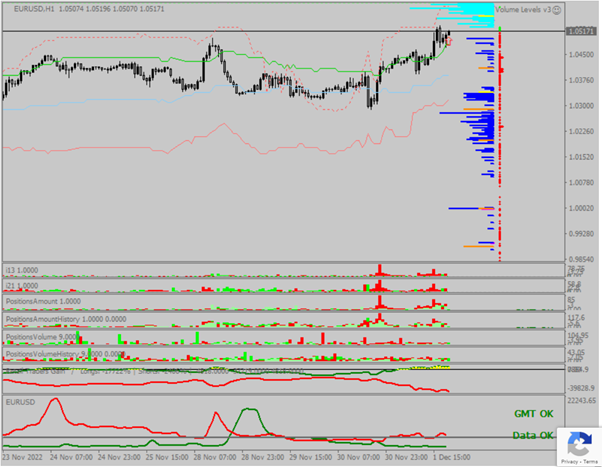
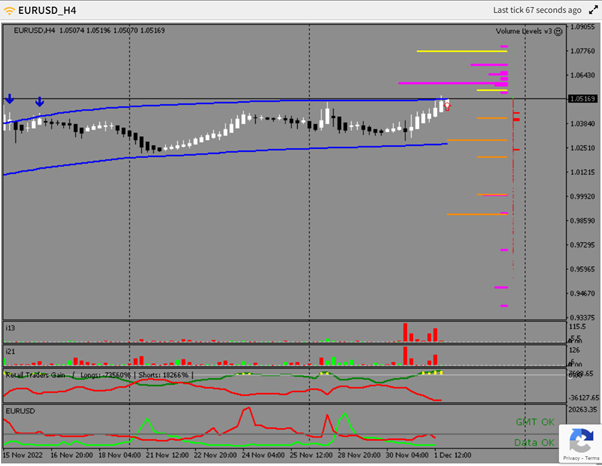
And then here was this in the EURUSD this afternoon.
Using conventional Technical Analysis:
Trade was framed as a 61.8% retrace buy-in, with the Fib Box being drawn from the pivot that tested and ‘resolved’ a significant Supply & Demand Zone (thin shaded blue box).
Also Consistency between Price and MACD Momentum (Convergence), indicating move up was still ‘strong’.Finally, the MK-Indicator shows a big cloud of mostly Blue near term Long SL. On the NFP release, there was a big push down, to clear out this Stop Loss Cloud, slightly overshooting into the gap (hitting a minor sized near term Long SL), leaving the next orange mid term long SL tranche untouched.
Seems to me that the blues are definitely not to be ignored. With the overall bias pointing to the upside, both from a conventional technical and MK-Indicator basis, A Rinse of all the Near Terms (using the NFP release as the pretext) provided a clinical long entry here.
- December 2, 2022 at 7:49 pm#46724Christopher MirandaParticipant
From what I can remember, the limit orders have been mentioned as incidental, but not so much the STS (all good either way, I can’t remember everything lol). But I would definitely agree and have always considered the STS to be important, ranging moves/days will commonly just slowly take out the STS only and can easily be traded.
I edited your pic to highlight one of the reasons its possible for price to move down even with so many shorties in the way. The shorties were in a big drawdown.In reply to your post above this one – I hope over time you come to see the MK similar as I do, as a near perfect work of brilliance 🙂 haha. Also, as you will see explained in some videos, MK simply evens the playing field. The forex market is inherently rigged, the SMcartel are the one’s who are literally cheating.
Beautiful entry on your EG short, amazing reading the move to the STS against the incoming shorties/red bars.- December 3, 2022 at 1:16 am#46749AnonymousInactive
Yeah….Shorts were hurting bad in EURUSD as you pointed out….with Longs in good profits….with weight of recent DM trades being longs chasing the ascending triangle breakout (which happened, for about 2 minutes before the smack down on NFP….
Regarding the red and green points on the right side of the screen (is that what you mean by ‘PBs’? ‘position bars’? ) What are they really though? It seems that any that are below price are red, and any that above price, are green, yet we know that a small percentage of the ‘Dumb Money’ is in profit, so why aren’t their positions shown in green, beneath price?
Also, I sat watching the EURGBP switch back and forth in price, turning one position bar green-red-green-red-green-red…etc. Not an aspect of the MK charts that I feel I can rely upon, or read too much into….and of course, in many of the other markets, even fairly well furnished ones such as AUDUSD, these are largely missing, as are the SL bars, even though we all know in reality (in the real FX exchange order books) there are hundreds of billions worth all over the place.
- December 3, 2022 at 5:51 pm#46855Tim TimParticipant
Ye Mat Iv noticed the same thing with the y-axis position bars. Not really sure about why the colour changes as the price moves trough the y-axis position bars.
- December 3, 2022 at 7:41 pm#46872Tim TimParticipant
What do you guys do with correlated pairs? Like say you have AUDUSD long setup but EURUSD is looking really bearish. Do you take that as a negative for your AUDUSD setup? And the other way around if EURUSD is looking really bullish do you take that a positive for AUDUSD setup?
- December 5, 2022 at 7:16 pm#47110Tim TimParticipant
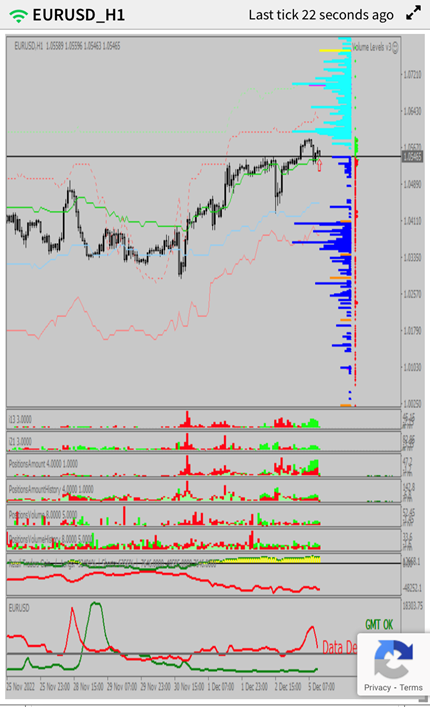
Trade: Long EURUSD
Trade idea: Move up to take out uper long term stops
Y-axis PB: Small amount of longs in the way & lower shorts to support price
X-axis PB: Large short positions
Net DM: Short sqeeze to Neutral
Net T-in-prof: Longs in profit but more shorts in market
Lev Positions: N/A
1D chart: no MA levels cleared 200MAEntry: 1.05181
SL:1.0280(below lower MT stop and short positions)
TP:1. 06400(just after upper LT stops)

Trade closed: large number of new longs came into market and Net-shorts decreased rapidly

- December 7, 2022 at 6:06 pm#47408Thuy PhamParticipant
EURGBP short
Entry: 0.86151
SL: 0.86242
TP: 0.86057Longies came into the market, NetDM was Longies bias. I’m still new to this, comments and opinions are welcome.
- December 7, 2022 at 6:52 pm#47416Christopher MirandaParticipant
Great simple scalp.
- December 8, 2022 at 8:12 pm#47547Tim TimParticipant
Nice one. And it had taken the local high for a fake out for added confidence.
- December 9, 2022 at 1:44 pm#47660Tim TimParticipant
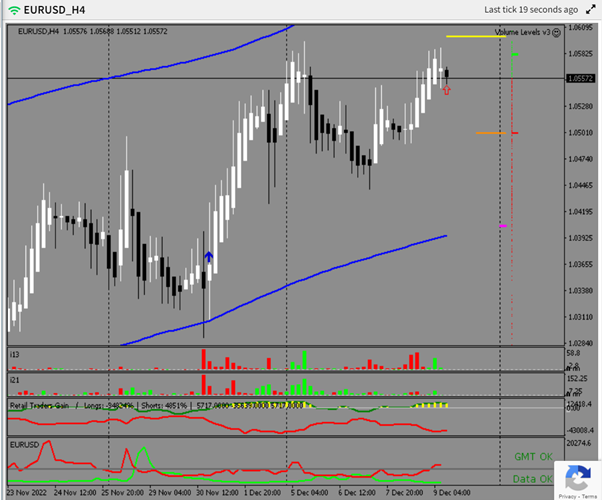
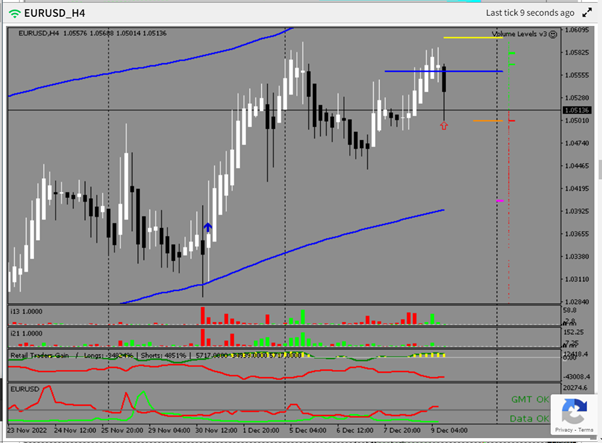
Trade: 09.11.2022 EURUSD scalp short
Trade idea: Range trade – Move down towards short nest and MT stop with long nest above blocking price
Y-axis PB: Longs blocking price above and TP just before short nest below (Positive)
X-axis PB: Fresh shorts just entering the market(Positive)
Net DM: On the short side with shorts turning up(Negative)
Net T-in-prof: Longs in profit(Positive)
Lev Positions: NA (Neutral)
1D chart: MA all below for targets (Positive)
Where in range: Middle of the range (Negative)Entry: 1.05584
SL: 1.06100 ( Above the long nest and MT stop)
TP: 1.05100 (Above short nest and MT stop)
Trade Closed: 09.12.2022 1.05099
Outcome: PPI Inflation came in high expected 0.2% was 0.4% so very quick move down to TP
Does anyone have an opinion on positioning yourself before news advents?
- December 9, 2022 at 2:30 pm#47674AnonymousInactive
AUDUSD Short.
On Trading View very standard stuff. AUDUSD has pushed up towards upper reaches of range, Divergence showing between price and Cumulative delta Volume Oscillators (one is simple BEAR BULL VOLUME….other is Elders BEAR BULL POWER), followed by strong sell off with HUGE bear candle on PPI news (or whatever the fk it was), forcing the Bull-Bear oscillators to switch bearish….conclusion. A short, aiming towards yesterdays low.
On MK Charts. What Bear or Dumb Money Long Volume? DM bears are in control. This means more upside is to come.
Lets just see how this plays out, and lets see what the MK charts have to say about the past few hours volume, when I check back after the London close.
- December 9, 2022 at 3:17 pm#47682Tim TimParticipant
hahaha you’re out to get MK.
AUDUSD is completely Neutral in my opinion looking at MK
- December 9, 2022 at 4:14 pm#47692AnonymousInactive
Perhaps it is neutral according to MK, but there is a glimmer of a sell setup there according to me.
Certainly wouldn’t throw the kitchen sink at it, but worth a small punt for those who like to keep active in the market.
- December 9, 2022 at 4:54 pm#47698Thuy PhamParticipant
Why did you go short when there are a lot of DM shorties in the market? Also the NetDM is short bias too
- December 9, 2022 at 5:08 pm#47699AnonymousInactive
What about all the DM longs that had recently entered the market prior to the short trade setting up.
You won’t seem them in the first MK screenshot I posted, but there are there in the 2nd one.
In the second screenshot, we also see the ‘DM shorts’ Positions start to ‘Pivot’ put in an M shape and we know that the DM highly leveraged positions are all longs…..of course, perhaps there is ‘DM tolerance’ in the market for the longs?
And what the current situation with the MK is, we won’t know for perhaps another SEVENTEEN HOURS, when the charts finally update…….which was precisely my point.
The short trade, is a throw away trade, risking precisely 0.01 lots…..and it may still work……Forex rarely gives M pivots….first it puts in the M, then rinses it, then tanks, giving traders deploying conventional strategies zero chance……..or maybe, the flash sell off on the PPI News was the Longs RINSE, and the MK indicator will shows us that in approximately SEVENTEEN HOURS from now, when all it’s orderflow data feed is updated.
- December 9, 2022 at 5:32 pm#47700Tim TimParticipant
Agreed MK wasn’t shouting short
- December 9, 2022 at 6:03 pm#47704AnonymousInactive
MK was touting SEVENTEEN HOUR old Volume Data.
That was my point, but I posted the wrong screenshot highlighting that fact. But go to my original MK chart screenshot, check out the volume prints on it back then, and compare that with the volume prints on it now.
On the first chart, there was SEVENTEEN HOURS of missing volume data, that has since been filled in.
There is no circumstances in which this is viable to a trader.
NONE.
Anyhow, fizzed and ranted enough…..I think I am done with this.
- December 9, 2022 at 4:12 pm#47689AnonymousInactive
AUDUSD Update:
Trade Entry Filled, but it looks like ‘they’ want the SL above the recent pivot. An overly aggressive trade tbh looking for the best entry…but v.small position size.
Also, looks like MK is now advising us that there was some DM volume traded through that last SEVENTEEN HOURS after all.
- December 14, 2022 at 3:58 pm#48350Admin SMEKeymaster
Hi Tim,
nice,
we will ask Djamal to have a look at this thread and comment within the next weeks.
Continue your work.SME FX
- December 14, 2022 at 4:01 pm#48352Admin SMEKeymaster
“Also, looks like MK is now advising us that there was some DM volume traded”
Have a look at the MK web! The charts clearly showed the DM shorties in AUDUSD. Also, look at the PB profile on the y-Axis.
There were no surprises.
Look at the SCALE of the upper histogram of the screenshot you posted. Got it?
SME FX
- December 14, 2022 at 4:03 pm#48355Admin SMEKeymaster
“Perhaps it is neutral according to MK, but there is a glimmer of a sell setup there according to me.”
Why would you sell when you clearly saw all the DM shorties (red bars) in the market already back then?
Back to basics.
SME FX
- December 14, 2022 at 4:03 pm#48356Admin SMEKeymaster
“Why did you go short when there are a lot of DM shorties in the market? Also the NetDM is short bias too”
Correct.
SME FX
- December 14, 2022 at 4:05 pm#48357Admin SMEKeymaster
Mat,
that volume position profile you use is pretty useless on its own. It does not adequately distinguish between what types of positions there actually are. Look at the MK and you will figure that out yourself.
Stay safe.
SME FX
- December 14, 2022 at 8:04 pm#48376Tim TimParticipant
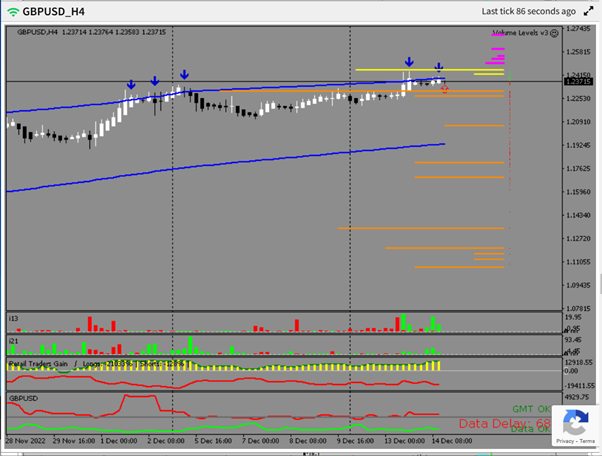
Can anyone explain why they wouldn’t have taken this trade?
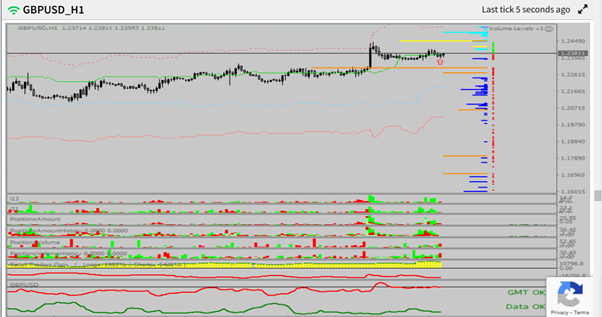
Trade: Short GBPUSD
Trade idea: Move down to take lower MT with all the new longs entering the market
Y-axis PB: Longs above blocking price and shorts blocking lower price (Positive)
X-axis PB: Large number of longs (Positive)
Net DM: Net short (Negative)
Net T-in-prof: longs in profit (Positive)
Lev Positions: NA
1D chart: MA’s below price (Positive)
Where in range: Top of range (positive)Entry: 1.23707
SL:1.247(above MT stop and all long positions
TP:1.23(at the lower MT stop

Trade update: Most of the longs left and shorts came in.

Trade Closed: Trade closed at open with push from hawkish FED
Outcome: Loss 1.23707
If anyone can tell me why I shouldn’t have taken that trade would be very helpful.
- December 15, 2022 at 12:52 am#48410Christopher MirandaParticipant
I can’t say I wouldn’t have taken it, but you closed near break-even, so if you’re hoping to get larger moves without any drawdown, then you would need near perfect entries which is very rare. Remember to be realistic, no ones perfect. There’s nothing to say your trade was utterly wrong, it may just have needed to be held for a few days or more, we shall see I guess.
For the MK, I would be concerned/aware that there are still significant MTS above, LTS are getting close finally (big concern), and NetDM has straight up a tiny amount of longies. The shorties aren’t overwhelming, but all of those previous points make it possible for price to go up a bit more before making big moves down. Personally I would be most concerned with those LTS in range, especially if Longies stay low in the next 1-2 weeks.
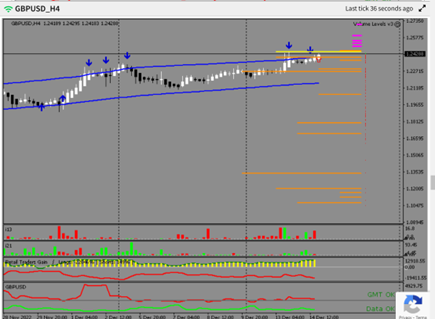
- December 15, 2022 at 4:47 pm#48499Christopher MirandaParticipant
Funny how well that short would have worked eh? It was a different MTS cloud from what was there the other day, but GU still utterly crushed all of those longies, and moved the full H4 range.
- December 15, 2022 at 7:42 pm#48520Tim TimParticipant
Ye I jumped in late but still rode the move down but I shouldn’t have closed at BE originally your right.
- December 15, 2022 at 8:57 pm#48532Christopher MirandaParticipant
you did what made sense, I prob would’ve done the same really.
- December 15, 2022 at 4:59 pm#48504Admin SMEKeymaster
Hi everyone,
Djamal gave a live session today and some of these market moves were captured live. We will try to make a compilation soon.
SME FX
- December 15, 2022 at 5:29 pm#48506Christopher MirandaParticipant
Yesssss hahaha I was so hoping he recorded some of the moves today! Constant med-high bias MK examples and easy trades today, would love to hear his opinion on why moves have been getting larger over the past few years also.
- December 15, 2022 at 7:43 pm#48521Tim TimParticipant
This would be great
- December 16, 2022 at 2:31 am#48559ImpliedOddsParticipant
Hi. I was having some steady, moderate success recently, but took a long trade in AUD-USD last night (EST) and got crushed. I was long with a very modest take profit target and red bars everywhere as you can see in the top charts. The resulting move went aggressively down. The opposite happened to me today on EUR/USD where I was short with green bars all over and i’m sure you saw where it went this morning. I’m just trying to make sense of this. Of course I understand that you certainly can’t win every trade (i’m far from that), but when I hear Djamal mention 95% win rates, it makes me wonder what other factors are in play that I don’t know about that can create movement in pairs that is so drastically in contrast to what the MK web is saying? I’ve watched so many hours of videos it’s been like a part time job recently, but I don’t feel as though i’ve learned what other factors could have prevented these entries because I feel that I followed the guidance in the videos. Any thoughts or similar experiences much appreciated.
- December 16, 2022 at 2:42 am#48561ImpliedOddsParticipant
Sorry! Attachment above was an error…
- December 16, 2022 at 3:36 am#48570Thuy PhamParticipant
Did you take the AU trade when all the longies started to come in? EU had Euro and USD news today, which clean out stops on both sides. I also took a short on EU after the news, but got out at BE.
- December 16, 2022 at 4:52 am#48582ImpliedOddsParticipant
Hey Thuy. I’ve attached the MK web at the time of my trade. Definitely a majority red, but now looking at it, the shorties are definitely waning. Learned something here. I need to be conscious not to get color blind and evaluate the recent strength of the longies/shorties on the chart. Thanks for checking in on this.
- December 16, 2022 at 4:00 am#48572Christopher MirandaParticipant
AU was near the top of the range, more likely to go down from there unless new shorts came in. We’ve all lost a shit ton in the past, don’t beat yourself up, just try to learn what we can from it and how to enter better from MK analysis. EU was a tricky one because it went up drastically (possibly cause of shorties that u can see on the historical histogram) then dropped heavy against the overall longies, a housecleaning of sorts. Can’t win em all I guess.
I edited the AU pic to show what went wrong. Personally I wouldn’t consider that enough red bars to hold the move after the high had been made.
- December 16, 2022 at 4:32 am#48581ImpliedOddsParticipant
Hey Chris. Thank you for the mark up. I really appreciate it. I think I have to get out of this PB bar color trance a bit. After looking at your mark up, I became aware of where the shortie bars were and in fairness they weren’t super recent. I think I just saw a long accumulation of red PB bars and didn’t focus in enough on the high and the most recent PB bars. Thanks again
- December 19, 2022 at 12:48 pm#49053Tim TimParticipant
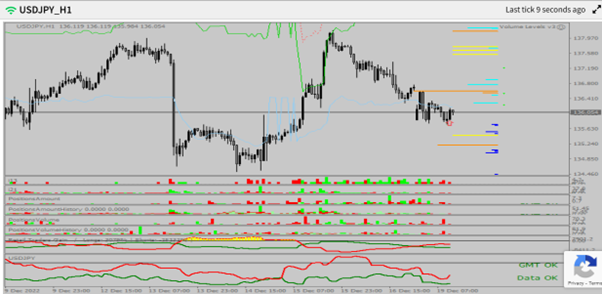
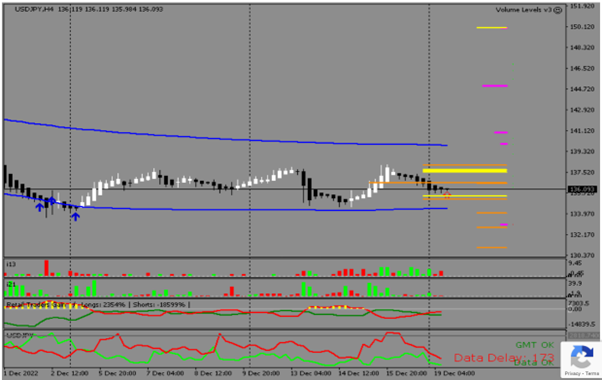
Nice direction stop target trade
Trade: Scalp long USDJPY 50% trade size
Trade type: Stop target scalpTrade idea: Move up against new shorts to take closest upper MT stop
Y-axis PB: Not clear, some small longs blocking price(negative) 0%
X-axis PB: New shorts just entered some old longs still in (Neutral to positive) 75%
Net DM: Net short with shorts spiking up (positive) 100%
Net T-in-prof: No position in profit (Neutral) 75%
Lev Positions: New lev shorts (positive) 100%
1D chart: MA below Price(positive) 100%
Where in range: lower ¼ of the 4H range (neutral) 50%Trade rating = 71%
RR ration = 0.73Entry: 136.1
SL:135.5 (below lower stops and MT stops and new longs)
TP:136.5 ( At closest upper MT stop)

Trade Closed: 50% of trade closed at target 136.55
50% left open will close if DM switch or MS weakness
- December 19, 2022 at 1:11 pm#49060Thuy PhamParticipant
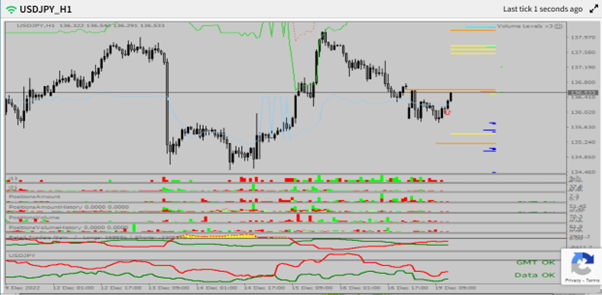
Hey Tim, that’s not a MTS at 136.5, orange lines above price are sell limit orders and yellow lines below price are buy limit orders. I could be wrong, someone please check
- December 19, 2022 at 2:01 pm#49061Tim TimParticipant
True, guess the LT stops did the trick
- December 19, 2022 at 2:05 pm#49062Tim TimParticipant
Maybe limits help to fuel a move because if you fill them – then push trough them, they are instantly under water.
- December 19, 2022 at 2:28 pm#49063Thuy PhamParticipant
Djamal said in a video the limit orders also help to fuel the move but not as important as the STS or MTS
- AuthorPosts
- You must be logged in to reply to this topic.