SME-FX › Forums › Commercial › What happened with DM indicator?
- This topic has 11 replies, 5 voices, and was last updated 2 years, 10 months ago by
 drayzen.
- AuthorPosts
- May 23, 2023 at 2:38 pm#72369
 BullFXtrade1Participant
Hi, today I noticed that the DM indicator flatlined on all currencies at the same time. Error in the data flow or did all the money just disappeared. I never seen this before.
- May 23, 2023 at 2:53 pm#72374Wesley OttoParticipant
Hi, also noticed it this morning.
- June 2, 2023 at 11:47 pm#73534Admin SMEKeymaster
Hi Bull,
that happens sometimes (albeit very rarely) when there was a data interuption.
SME FX
- September 12, 2023 at 12:02 am#83313drayzenParticipant
I sent a message via the contact form with some pre-signup questions, though have not received a response.
I see only mentions of MK Web.
If I sign up to the Individual subscription do I also get it in Indicator form?
This is what I would much prefer to have.Can anyone answer these questions for me as it appears that I’m not going to receive a response to my contact form inquiry.
– What is the difference between the Individual and Corporate subscriptions?
I’m curious who the intended audience is for the Corporate subscription, given the whole premise of this data / system is supposedly to combat the SM..
Why would you then offer an “SM” subscription..? Seems weird.
– There is a lot of ambiguity around the data being presented.
I see many similarities to Market Profile / Tick Volume indicators, and also CoT data.
Can anyone confirm what the data being presented actually is?
Anyone that has used the above mentions, can you confirm this data to be unrelated..Given how this data is presented, I’d expect to have some more understanding provided than just “trust me bro” it works.
Otherwise, how am I to know this is actually any different to all of the other ICT’s etc. with their faked results..?I’ve seen it said that it’s not order book data. So if it’s not that, and it’s not any of the above I mentioned, then what?
Options / Futures data..?
I know that I would also find it beneficial when it comes to applying it to know what it is I’m actually referencing to make my trade decisions.
Perhaps it’s a clever combination of all the above..
If that’s it, then great, well done.
Though you can’t expect me to sign up for a “black box” with no understanding of what data I’ll receive or how I’ll be able to access / apply it.
e.g. Do I get an indicator I can use for an EA to reference for automated trading?thx
- September 14, 2023 at 12:05 pm#83444Matthew ShellardParticipant
Hey Drayzen,
I’ll take a crack at answering your questions, but please note, I am not a MK Web subscriber as I have developed my own strategies based off of Djamal’s theories.
What is the difference between the Individual and Corporate subscriptions?
– I believe the only difference is the entity type that you will be signing up as. If you are a retail trader, trading in your own capacity, then you will fit an Individual subscription. However, if you are signing up with a corporate identity, i.e., you have wrapped you trading accounts into a business entity, or you are part of a team of traders, then you would signed up under a Corporate subscription. From my understanding, both subscriptions are to the same web feed, the only difference being price point. It seems like this is based on honesty, with Corporate subscribers being asked to do the correct thing and not sign up under an Individual subscription portal.
Why would you then offer an “SM” subscription..? Seems weird.
– I believe Djamal is trying to even the trading playing field by allowing retain traders access to the technology that he has developed. He isn’t providing his complete strategy, thus not giving away his edge and affecting his alpha, but allowing traders to view the underlying market dynamics and retail flow.
Can anyone confirm what the data being presented actually is?
– Yes and no, as this is part of the secret sauce. I can confirm that it is not CoT data (although this is one of the starting points for those on their smart-money journeys, and easily accessible), nor is it based on tick volume/market profile. The data presented is unrelated to price movements, and represents actual participants in the market.
Given how this data is presented, I’d expect to have some more understanding provided than just “trust me bro” it works.
– Pretty much is “trust me bro”, but seeing is believing, and there is a lot of video “evidence” on his YouTube channels and ForexFactory thread. I used these as a starting point for figuring out the system, and creating my own trading style based on the flow.
I’ve seen it said that it’s not order book data. So if it’s not that, and it’s not any of the above I mentioned, then what?
– I am not certain about the option strikes that may be shown (maybe someone else can chime in?). There is orderbook data that is shown, but it is not depth of market. Think of it more as a lower frequency trading.
Do I get an indicator I can use for an EA to reference for automated trading?
– You do not get indicators, per say, you get access to a web interface of live chart screenshots with all of the proprietary indicators shown. There are a few videos that show what the interface looks like – I am not a subscriber, so cannot give an overview.In ending, the data works and exposes the true market dynamics, but may not work according to an individual’s trading style. Some people trade towards the stop-losses, others wait for the stop-losses to be cleared and trade the retracement, others may not be concerned with those and only trade in the direction of the flow – it all comes down to fitting this now information into your existing trading plan as an added layer of confidence.
Hope that answers some of your questions!
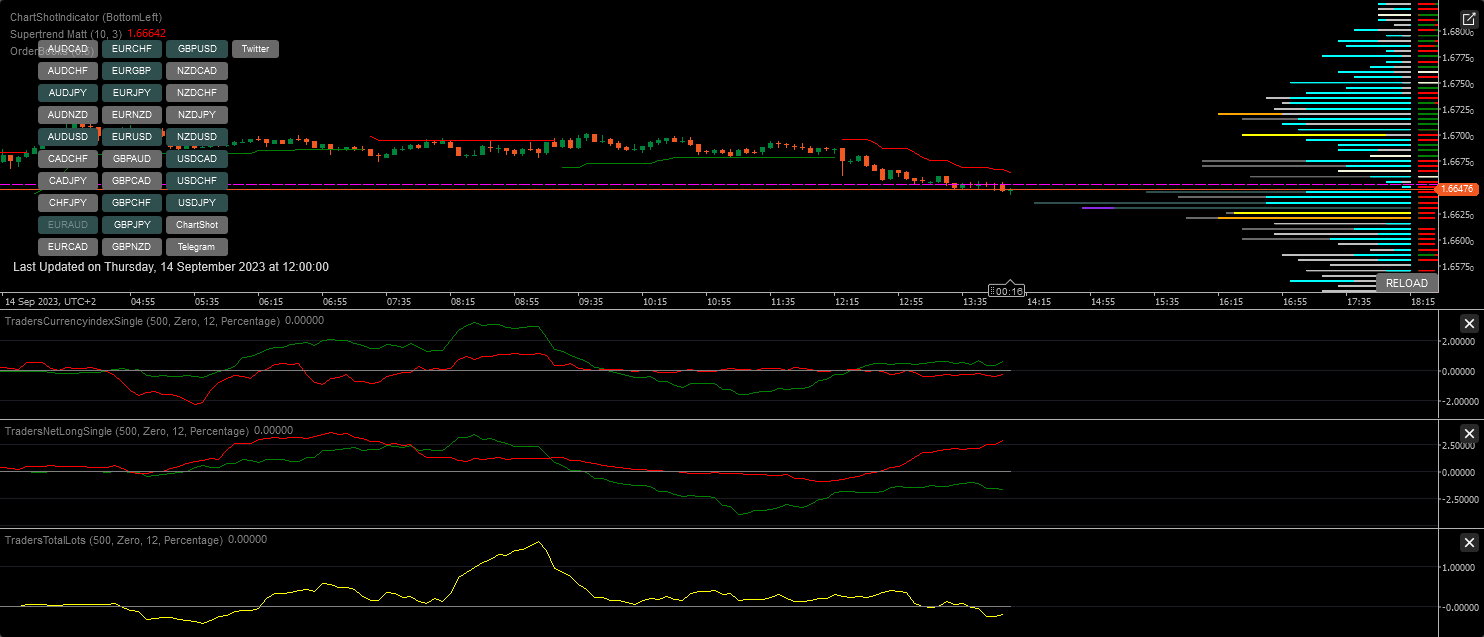
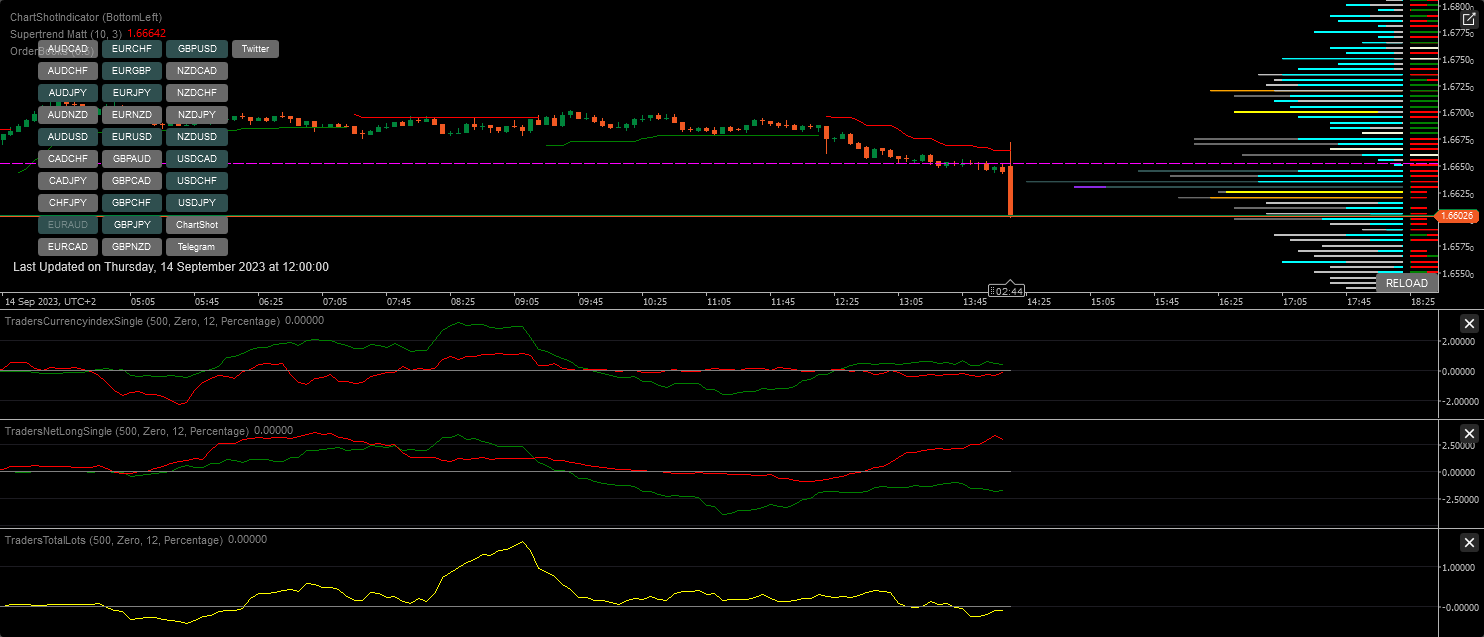
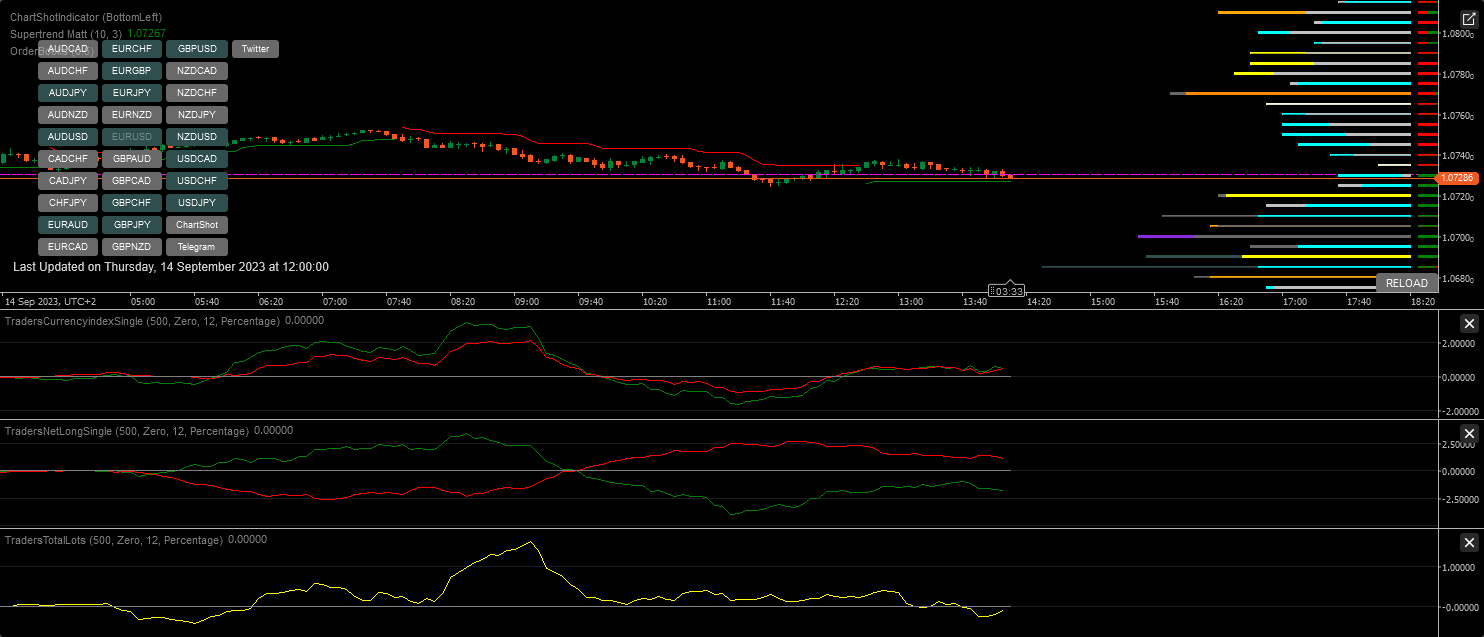
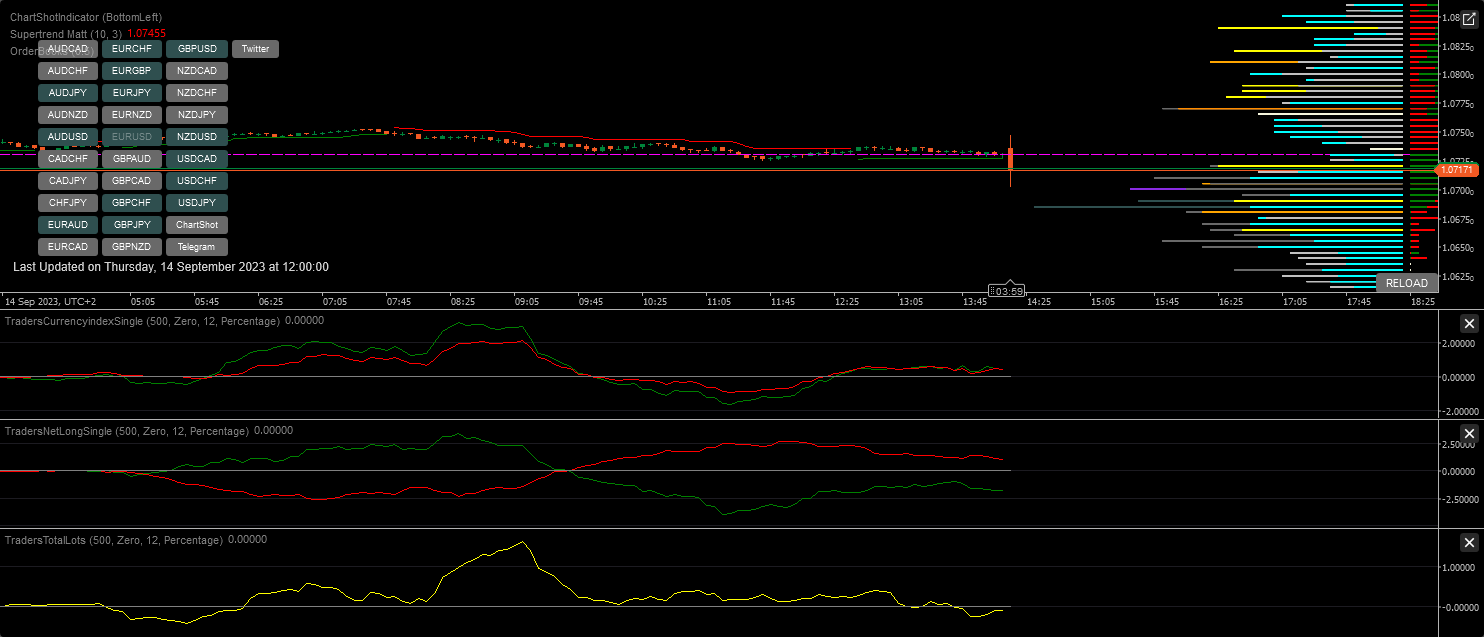
- September 14, 2023 at 12:21 pm#83447Matthew ShellardParticipant
Example of my charts during the ECB rates today:

- September 15, 2023 at 5:04 pm#83591drayzenParticipant
Hey Drayzen,
I’ll take a crack at answering your questions, but please note, I am not a MK Web subscriber as I have developed my own strategies based off of Djamal’s theories.
What is the difference between the Individual and Corporate subscriptions?
– I believe the only difference is the entity type that you will be signing up as. If you are a retail trader, trading in your own capacity, then you will fit an Individual subscription. However, if you are signing up with a corporate identity, i.e., you have wrapped you trading accounts into a business entity, or you are part of a team of traders, then you would signed up under a Corporate subscription. From my understanding, both subscriptions are to the same web feed, the only difference being price point. It seems like this is based on honesty, with Corporate subscribers being asked to do the correct thing and not sign up under an Individual subscription portal.
Why would you then offer an “SM” subscription..? Seems weird.
– I believe Djamal is trying to even the trading playing field by allowing retain traders access to the technology that he has developed. He isn’t providing his complete strategy, thus not giving away his edge and affecting his alpha, but allowing traders to view the underlying market dynamics and retail flow.
Can anyone confirm what the data being presented actually is?
– Yes and no, as this is part of the secret sauce. I can confirm that it is not CoT data (although this is one of the starting points for those on their smart-money journeys, and easily accessible), nor is it based on tick volume/market profile. The data presented is unrelated to price movements, and represents actual participants in the market.
Given how this data is presented, I’d expect to have some more understanding provided than just “trust me bro” it works.
– Pretty much is “trust me bro”, but seeing is believing, and there is a lot of video “evidence” on his YouTube channels and ForexFactory thread. I used these as a starting point for figuring out the system, and creating my own trading style based on the flow.
I’ve seen it said that it’s not order book data. So if it’s not that, and it’s not any of the above I mentioned, then what?
– I am not certain about the option strikes that may be shown (maybe someone else can chime in?). There is orderbook data that is shown, but it is not depth of market. Think of it more as a lower frequency trading.
Do I get an indicator I can use for an EA to reference for automated trading?
– You do not get indicators, per say, you get access to a web interface of live chart screenshots with all of the proprietary indicators shown. There are a few videos that show what the interface looks like – I am not a subscriber, so cannot give an overview.In ending, the data works and exposes the true market dynamics, but may not work according to an individual’s trading style. Some people trade towards the stop-losses, others wait for the stop-losses to be cleared and trade the retracement, others may not be concerned with those and only trade in the direction of the flow – it all comes down to fitting this now information into your existing trading plan as an added layer of confidence.
Hope that answers some of your questions!
Hi Matthew,
Thank you for at least attempting to answer my questions.
Honestly really disappointing that I’ve not received any response at all to my contact form inquiry after so long. All I can assume is they don’t like my questions so ignored me completely..
Not a great look.Where you talk about viewing MK Web, you said it’s actually only screenshots.
Is that correct, it’s only screenshots and not live charts?
Not sure how you could possibly achieve any real trade accuracy in the 1h / 4h time frames commonly shown in examples without live charts..I prefer to trade Daily / Weekly time frames, so wondering if this date is of any use for me..?
Given the addition of Options Strike targets, it’s got me thinking it’s perhaps Options / Futures data giving the insights.
I actually don’t mind signing up to give it a try without knowing exactly how it works if it is actually some clever display of unique market data not shown elsewhere.
Though I’m not aware of any publically inaccessible data other than order books.
So if it is referencing public domain data, then just be open and say so. If there’s been solid work put in to display it in a useful way then I have no problem paying someone for their efforts in doing that.
It’s the international ambiguity that makes me suspicious that it’s just the same few indicators I’ve mentioned being bundled together and displayed slightly differently.
The only one I didn’t mention that looks similar to Currency Strength inductors. The original work for which as far as I’m aware was this author.
https://www.mql5.com/en/articles/1472The minimum I do want to know is exactly what is included, which I think is perfectly reasonable to ask, though I can’t even get a response to that..
I really don’t know why such a complex website has
been made for this, that appears to be trying to cover a multitude of various topics, mostly in a “Coming” state when not even basic communication can be managed.. - September 17, 2023 at 6:03 am#83635Matthew ShellardParticipant
Hi Drayzen,
Not a problem. I’m sorry to hear that you still haven’t had any official contact.I presumed that it is screenshots, which are updated on a tick-by-tick basis. You can briefly see an example in this video (https://www.youtube.com/watch?v=dO9egHjQzfM&ab_channel=SmartMoneyEliteFX), however, if I recall correctly, there are some better examples in other videos on the channel.
I agree and disagree with being open about what their data source(s) is/are. It seems like it is a main component in their trading strategy, so why give everyone the raw source and have them circumvent your product offering? Doing so could take away their trading edge. Rather hinting about what the data is, and what it encompasses, should be more than enough for users to go on their own journey and find various sources of what is offered.
Currency Strength is something that I use in my own trading, but more as a rate-of-change indication. I personally trade 5-minute charts, so I’m interested in the strength change over the last hour, and 8-hours, as extra filters.
I agree that the website should be refactored a little, or perhaps unused sections hidden. But I guess we must also understand that this isn’t his main source of revenue, but rather a side project used to bring more knowledge to us.
😊
- September 18, 2023 at 11:27 am#83679Admin SMEKeymaster
Hi Drayzen,
you should have used the “free trial week” (see youtube video), then you would have seen yourself how the MK web looks.
The MK web shows you all the charts, of the different markets and time frames. Many people trade off these charts.
Since the charts “auto update” every few seconds, you can of course trade the H4 or DC with these. As you will see, the market causality unfolds over hours most of the time.
The MK blog also shows you Djamal´s live analysis.
We do not sell EAs or indicators.
Each chart / indicator needs a multitude of complex data streams, so it would not make sense to sell the indicators.
Our technology was developed over years and is proprietary. It is impossible to “mimic” the market causality with conventional indicators.
Yes, the website is currently going through some updates. For example, Djamal decided to not continue the “FX Watch” etc.
All the best,
SME FX - September 18, 2023 at 11:28 am#83681Admin SMEKeymaster
- September 30, 2023 at 1:04 am#84307drayzenParticipant
Hi Drayzen,
you should have used the “free trial week” (see youtube video), then you would have seen yourself how the MK web looks.
The MK web shows you all the charts, of the different markets and time frames. Many people trade off these charts.
Since the charts “auto update” every few seconds, you can of course trade the H4 or DC with these. As you will see, the market causality unfolds over hours most of the time.
The MK blog also shows you Djamal´s live analysis.
We do not sell EAs or indicators.
Each chart / indicator needs a multitude of complex data streams, so it would not make sense to sell the indicators.
Our technology was developed over years and is proprietary. It is impossible to “mimic” the market causality with conventional indicators.
Yes, the website is currently going through some updates. For example, Djamal decided to not continue the “FX Watch” etc.
All the best,
SME FXHi Admin,
Thanks for responding.
Still a little disappointing that my contact form inquiry was never responded to if there are admin staff such as yourself, or are you only a Forum moderator?
Anyways, as I said the cost of the service was not my concern, it was that there’s no clear information on the website about exactly what is provided with a subscription.
I know there are a lot of YouTube videos, though some clear wording about inclusions on the Pricing page would have been helpful.
e.g. It’s still unclear to me whether the ‘Blog’ subscription includes access to MK Web or is only the Blog (which now after subscribing to ‘Individual’ I find I don’t have access to) and what information is in there that I would want to subscribe for.Having now looked at the data I’ve got some ideas for improvements which I’ll post elsewhere..
- September 30, 2023 at 1:23 am#84308drayzenParticipant
Example of my charts during the ECB rates today:
Thanks for your help.
Would you mind discussing the details of this setup you’re showing?
Maybe better to post in the ‘Indicators’ forum..
Understand if you prefer not to post here as to not cause conflict (@drayzen Telegram / @drayzen_au Twitter)
cheers
- AuthorPosts
- You must be logged in to reply to this topic.