Forex analysis with the ´MK web’ tool
Discover FOREX with the ‘market causality’
Successful currency trading requires a proven edge. The MK web tool allows for accurate market analysis, this by taking into account where certain positions and orders are actually placed in the market. Hence, this article presents the proven approach of what I call “market causality”.
Many of you have probably tried trading the international currency market, only to be deterred by the complexity of its price movements. Many traders ultimately have negative experiences in the currency market and also suffer heavy losses. A purely statistical approach (i.e. based on conventional, price-based indicators) has little chance of success. The same applies to the isolated approach of fundamental analysis or technical analysis. When it comes to foreign exchange, we need to understand what actually moves the price. The MK web tool shows you exactly that, this in real-time.
Nowadays, many traders accept the fact that global currency markets are subject to a very specific market structure that is not necessarily related to traditional ‘supply and demand factors’.
Stop Hunting: When stop orders are cleared.
Phenomena such as ‘stop hunting’ are not only an everyday reality, but often determine the direction of the next price movement. In this context, I would like to explain market causality in foreign exchange trading using various examples. In today’s world, it would be completely ignorant to ignore the aforementioned phenomenon of stop hunting. Even many beginners in FX trading quickly notice that they can often observe how their stops are triggered, only to then suddenly see the market turn back in the original direction. Inexperienced retail traders often place their own stops directly above the last high (for a short trade), for example; such approaches rarely lead to good results in the long-term.
As an FX trader, it is important to understand the dynamics of stop hunting and to integrate these into your personal trading strategy. Stop hunting is not a marginal phenomenon, but rather a daily reality. We need to go one step further, because stop hunting is only one particular aspect of the market causality. For example, there is also what I call ‘position hunting’.
The importance of ‘position hunting’
While there is now a great deal of content on the subject of stop hunting, this is not the case for position hunting. We use the market causality as an analytical approach and take into account both ‘stop hunting’ and ‘position hunting’ in our analysis. Position hunting implies that Smart money algorithms (SM Algos) ALWAYS include in their calculations where the dumb money might positions are placed in the market. Accordingly, it is not enough to understand the dynamics of stop hunts; it is also necessary for traders to take the accumulated positions of “dumb money” into account regarding their analysis. Even experienced traders often do not understand the importance of this subject. To summarize once again: stop order accumulations are the price zones in the market that ultimately represent the target of SM algorithms. In the end, these price levels and zones are cleared by the price clearing these out. However, an equally important aspect of the market structure is “position hunting.” Here, the positions of the “weak hands” (which have already entered the market) are “priced in” with counter-movements, so that traders who were actually ‘correctly’ positioned are forced out of the market before any stop hunt moves are implemented. By following such principles, SM algorithms ensure that no speculators on the “dumb money side” are able to trade profitably in the long-term.
Market causality — getting to the root of the cause.
This brings us to the main topic. Contrary to popular belief, currency markets are by no means “random.” On the contrary, there is a clear ‘causality’ between the market structure and respective price moves, which can be quickly identified using institutional tools such as our MK Web Tool. I therefore call this trading approach “market causality”; this to emphasize the actual nature of the FX structure. The market causality analysis approach takes real market phenomena into account, allowing traders to quickly see why certain scenarios unfold as they do.
The number of relevant factors goes far beyond ‘stop hunting’ and ‘position hunting’. Other aspects, such as option strike targets, also play a role (on our SME FX YouTube channel you can find a complete, free “MCA made simple course”). This is a trading approach that not only integrates all these various factors (such as stops, DM positions, option strikes, order gaps, etc.) into the analysis, but also makes use of the MK Web Tool, as this important information is displayed via the MK web in real-time. The MK Web Tool is an analysis tool that allows traders to adapt their strategy to the current market structure, thus avoiding becoming victims of stop hunts, position hunts, etc. We will look at a concise example. The tool is web-based and available for GBP 59 per month (prices may have changed).
Instead of conventional price-based indicators, the MK web uses data-based indicators for the analysis. These indicators display integrated market information live and do so in a visually appealing way, allowing traders to quickly determine whether the market structure favors their trade idea or not. With the MK Web Tool, traders can also wait for predefined trading setups and then implement these trades with conviction.
There are a number of documented setups that enable experienced traders to achieve consistent performance. Examples include trading direct stop hunts, trading countertrends, trading against new DM positions entering the market, option strike hunts, H4 reversals, and many more (you find a list on this website). Many traders specialize in specific setups or adapt to the market mode on a daily basis. Let us now look at a concise example.
A trade setup with EURUSD on the 4-hour chart
As you can see, on February 27, 2025, several ‘dumb money buy positions’ accumulated just above the EUR/USD price (green bars). For various reasons, these market participants decided to predict an upmove in EURUSD.
It is therefore likely, that Smart money algorithms are driving the market in the opposite direction with the intention of forcing these buyers out of the market (often several times). The MK web tool clearly shows that new dumb money buyers have gone long in EUR/USD in the last few hours. After the Smart money algorithms briefly cleared the high with a small “fish bar” (so that any dumb money sellers with tight stops are not pulled into the profit), they finally push the EUR/USD price down. With each additional pip, more and more dumb money buyers are pushed into drawdown or cash in their losses (as their stops are triggered). See Figure 1 for more information.
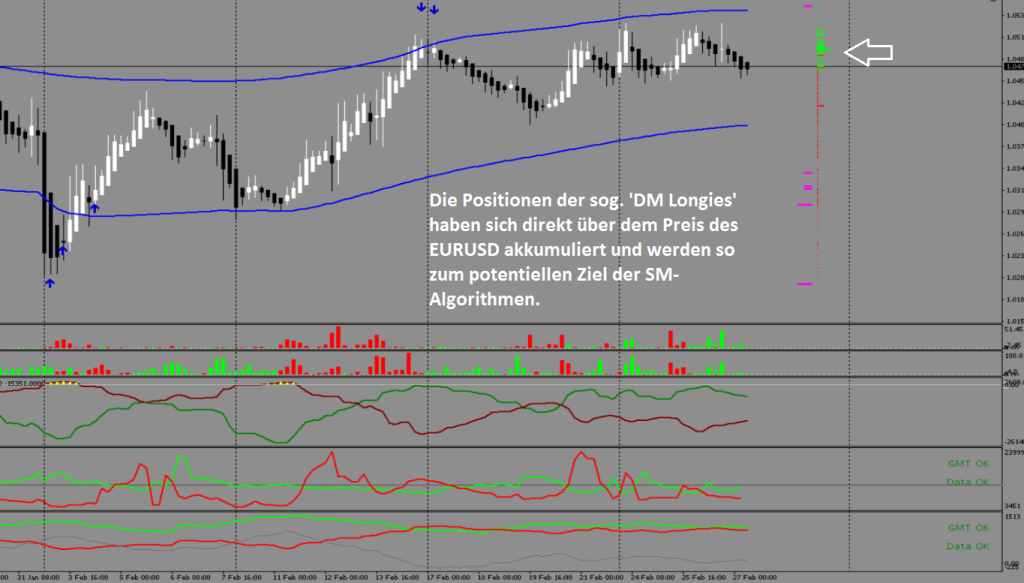
Image 1: EUR/USD on a 4-hour chart (Here you can see how the MK web tool efficiently displays the market structure. In addition to the arrow, the DM buy positions are clearly visible and the trader can avoid this “trap” by not trading long herself).
Source: MK web tool (It would go beyond the scope of this article to explain all the other indicators in detail, but you are welcome to watch the free videos on our YouTube channel).
The further course is shown in Figure 2.
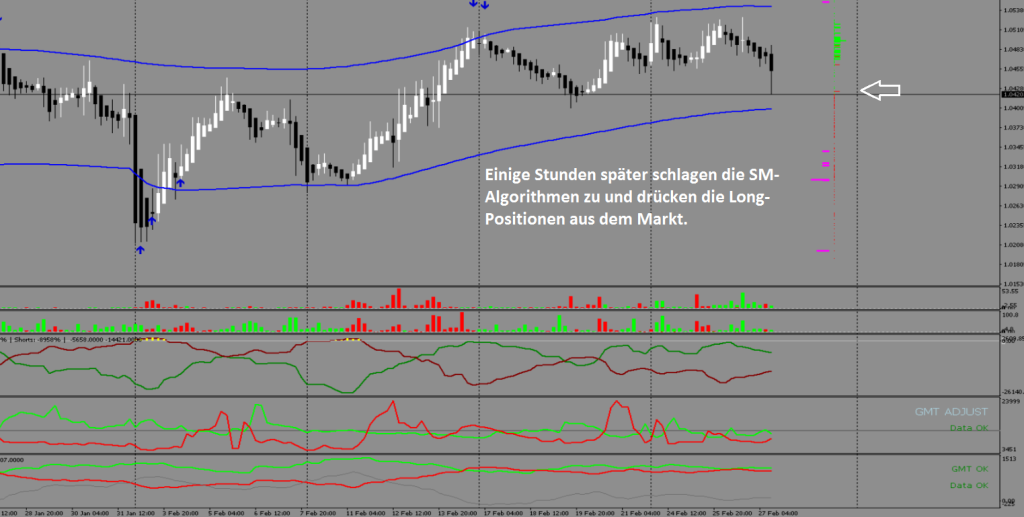
Figure 2: EUR/USD on a 4-hour chart
Source: MK Web Tool
The chart shows the further price action based on Figure 1. In fact, the SM algorithms pushed the price down against the accumulated ‘DM longies’, causing them to incur losses. With each additional pip southward, more and more buyers have to realize their losses or are stopped out of the market (or, in the worst case, receive a margin call). Overall, the EUR/USD has fallen by more than 80 pips as a consequence.
This simple example already shows the factors that drive modern currency markets. The only way to continue trading successfully despite these documented phenomena is to have qualitative analysis tools (such as the MK Web Tool) at your disposal and also to respect a defined risk policy. Both components are essential: the actual analytical edge as well as a high degree of discipline.
Make Markets Fair Again!
As the above example shows, the ‘market causality’ covers the entire market structure in the FX sector; in fact, there are a number of other factors that are included in market analysis. However, showing and explaining each of these factors here would certainly go beyond the scope of this article (for this, watch our YouTube channel and then the MK video course on this website). But to give you at least a better impression, we can also look at a screenshot of the MK web tool on the lower time frame.
Trading on lower time frames
The MK Web tool displays the price charts of all major Forex pairs in different time frames. Let us now take a look at an H1 chart (see Figure 3). As you can see, the H1 chart provides detailed information that traders can use for their purposes. If you want to trade lower time frames such as M30 or H1, you should of course have some experience beforehand. The aim here is to identify moments in the market that allow for efficient trade entries, this even in the short-term. You should also keep an eye on upcoming economic data. However, the screenshot clearly shows that all “medium-term stops” (horizontal green lines) were ultimately taken out. Of course, many of these moves are tradable themselves.
Image 3: GBP/USD on a 1-hour chart (from February 27, 2025)
Source: MK Web Tool
On the H1 chart of GBP/USD (displayed on the MK Web tool), we see more of the factors mentioned above. We see the green horizontal lines, which represent the medium-term stop accumulations (MTS). These lines often become price targets. We also see the short-term stop accumulations (STS) on the Y-axis, shown in blue. On the left side, we can see the so-called “option strike targets,” which appear as red arrows on the MK web tool (OST). The market price often touches the horizontal “target line” of the arrows displayed. The gray-colored blocks on the price are “order gap zones (OGZ),” which indicate open limit orders. These price zones are often targets for SM algorithms, too. If you are interested in better understanding all these factors, please watch our YouTube videos on these topics. You won’t regret it.
Diverse applications of the “market causality (MK)”
The MK web tool finally provides affordable technology that enables buy-side and retail traders to achieve better trading results, this despite the market manipulation of the SM. Typical market traps such as ‘stop hunts’ or ‘position hunts’ are thus avoided. Of course, market analysis remains a discretionary process, but the market causality enables the trader to trade in consideration of the actual dynamics. Investing the necessary time into the ‘market causality approach’ opens up new horizons that were previously reserved for institutional traders only.
Furthermore, the market causality is used in various ways by traders worldwide. Some traders use the market causality merely as a “higher-level filter” for their trading systems or signals. The trading decision remains discretionary. Other traders use the market causality to determine when to switch their automated systems on or off. In doing so, it is always necessary to distinguish whether the market is in an upward, downward, or sideways trend (which is shown by the so-called squeeze indicator).
Conclusion
As you can see, there is an institutional analysis tool for private traders that will enable many traders to rediscover the foreign exchange market for them. Obstacles that previously seemed insurmountable can now be overcome. I personally recommend that every FX trader first familiarize themselves with the causality of the market and then to trade on a demo account. Only then should a live account even be considered.cFinally, I recommend that you take a close look at all the free content on our YouTube channel.
I wish you every success!
Djamal Marcel Adib
CEO SME FX
#mkweb #mkwebtool #EURUSD #GBPUSD #EURGBP #AUDUSD #NZDUSD #USDCAD #USDJPY #EURJPY #GBPJPY #EURAUD #GBPAUD #AUDJPY #fx #forextrader #forexEXPOSED #nobstrading